Like a compass rarely pointing true in the same direction, battery chemistries shift with evolving goals. We’ll map LiCoO2, NMC/NCA, LFP, and LiMn2O4 against energy density, power, safety, and cost, tying each to form factor, packaging, and lifecycle expectations. Our focus is on end-to-end design, scalable roadmaps, and manufacturing maturity, with real-world tests guiding warranties and maintenance intervals. If you’re planning a robust path forward, the trade-offs you’ll confront will become clearer as we unfold the comparisons.
Key Takeaways
- LiCoO2 offers high energy density but limited thermal stability; balance with NMC/NCA for mid-range automotive needs.
- LFP provides superior thermal safety and longevity at lower voltage, while LiMn2O4 emphasizes power and cost advantages with lower energy.
- Solid-state and Li-po form factors enable higher packing density and thinner layouts, but real-world gains depend on packaging and interfaces.
- Performance trade-offs hinge on power delivery, cycle/calendar aging, and duty cycles, influencing design choices per application.
- Safety and reliability hinge on electrolyte/separator design, thermal management, and targeted testing across chemistries.
What Lithium Battery Chemistries Exist and Where They Fit
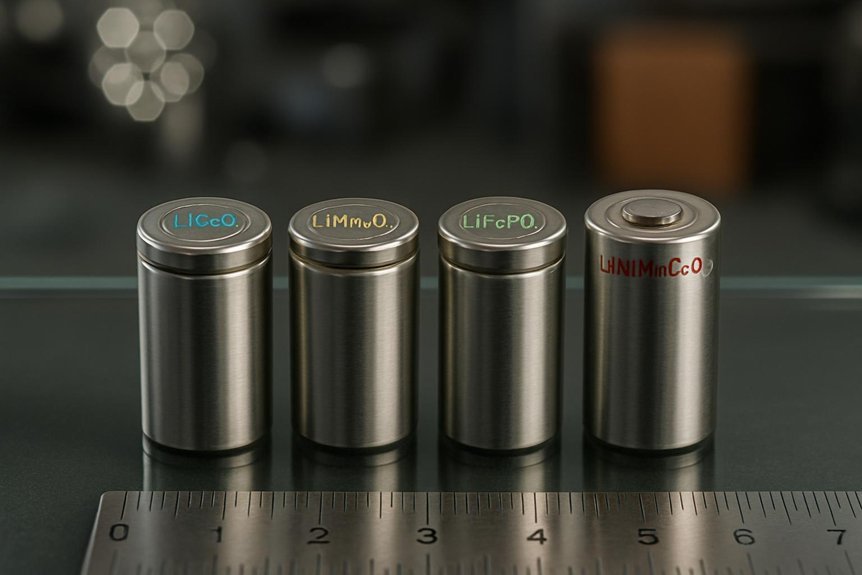
There are several lithium battery chemistries in common use, each with distinct performance profiles and suitable applications. We assess LiCoO2, NMC, LFP, and LiMn2O4, mapping voltage windows, capacity, cycle life, and safety. LiCoO2 offers high energy density but limited thermal stability; NMC and NCA balance density with improved durability, expanding mid-range and automotive roles. LFP delivers exceptional thermal safety and longevity at lower voltage, ideal for stationary and e-mobility missions. LiMn2O4 provides robust power and cost benefits but lower energy. Across chemistries, performance hinges on electrode materials, electrolytes, and separator design, driving innovative materials and manufacturing convergence. We emphasize targeted applications: consumer electronics, e-bikes, and grid storage, where tradeoffs between energy, power, and safety determine the optimal chemistry.
Energy Density: Li-Ion vs Li-Po vs Solid-State-Where It Matters
We compare energy density across Li-Ion, Li-Po, and solid-state chemistries to reveal practical tradeoffs for form factors and pack design. By quantifying energy density tradeoffs and how form factor constraints influence system-level choices, we highlight where each chemistry shines or falls short. Our goal is to map these distinctions to real-world applications where size, weight, and packaging drive performance.
Energy Density Tradeoffs
How do energy densities compare across Li-ion, Li-po, and solid-state chemistries, and why does that matter in practice? We examine tradeoffs with a careful lens, focusing on usable energy per mass and per volume. Li-ion and Li-po typically deliver similar gravimetric densities, but Li-po packaging enables thinner, lighter form factors and tighter layouts, affecting volumetric density and system footprint. Solid-state chemistries promise higher theoretical energy density, yet practical yields depend on electrolyte and interface engineering, packaging, and thermal constraints. The tradeoffs extend to thermal management: higher energy density systems demand more rigorous cooling strategies and fault mitigation. We prioritize reliability and cycle life, recognizing that marginal gains in energy density can introduce complexity, cost, and integration risk if thermal and safety margins aren’t maintained.
Form Factor Implications
Do form factor innovations drive energy density benefits, or do they mainly enable tighter packaging and system integration? We approach this by weighing how form factor shapes chemistry benefits in Li-Ion, Li-Po, and solid-state designs. Physical compatibility with existing modules constrains adoption—joints, housings, and connector schemes must align across chemistries. Li-Po’s flexible envelopes can reduce casing waste yet introduce sealing and rupture risks that alter energy density calculations. Solid-state cells promise higher energy density per volume, but real gains depend on stackable packaging and thermal interfaces within constrained volumes. Regulatory hurdles influence cell format choices, particularly safety testing and certification paths. Manufacturing processes determine yield, planarity, and scale, ultimately affecting cost-per-watt. In sum, form factor governs integration, with energy density improvements realized only through end-to-end design optimization.
Power Delivery, Cycle Life, and the Trade-Offs by Chemistry
We compare how different chemistries balance power delivery with cycle life, outlining the practical trade-offs drivers like internal resistance, safety margins, and thermal behavior create. We’ll consider how high-drain needs tighten voltage sag tolerance and shorten life, while longer-cycle designs favor stability and longevity. Our goal is to establish a clear framework for choosing chemistry based on required power profile and expected usage cycles.
Power Delivery Trade-Offs
Power delivery is a key constraint in choosing a lithium battery chemistry, and the trade-offs among power, cycle life, and overall efficiency vary by chemistry. We quantify power delivery as discharge rate capacity and real-world current capability, then compare how each chemistry handles peak load. Higher discharge rates improve instantaneous performance but can elevate internal resistance and stress, reducing efficiency and thermal margins. We examine how fast transient demands influence voltage sag, heating, and control strategy, noting that some chemistries tolerate spikes better than others. Safety considerations, including thermal runaway, constrain usable power envelopes. We emphasize that high-power chemistries often trade some cycle life for sustained peak output, while lower-power chemistries emphasize longevity with moderated current. Our guidance centers on matching discharge rate profiles to application-specific power and thermal budgets.
Cycle Life Considerations
How cycle life interacts with power delivery defines the usable envelope for each lithium battery chemistry. We examine how cycle degradation and calendar aging shape performance over time, balancing capacity retention against high-rate demands. In high-drain chemistries, rapid ion movement can accelerate cycle degradation, lowering available capacity after fewer cycles, even as instantaneous power remains strong. Conversely, chemistries optimized for longevity often sacrifice peak power to slow aging processes. Calendar aging, driven by calendar time at temperature, compounds cycle effects by reducing cells’ realistic usable life if stored or used in favorable conditions too long. We assess trade-offs by chemistry: lithia-moth formulations typically exhibit better calendar stability yet moderate cycle life under aggressive cycling; nickel-rich variants may deliver higher initial power but incur sharper degradation. Overall, lifecycle planning must align with end-use duty cycles.
Safety and Temperature Performance, Failure Modes by Chemistry
Safety and temperature performance vary markedly by chemistry due to intrinsic thermodynamics, reaction kinetics, and design trade-offs; lithium iron phosphate tends to be thermally stable with higher abuse tolerance, while nickel-rich chemistries can deliver higher energy but exhibit lower thermal runaway thresholds and faster propagation under overcharge or heating. We examine how each chemistry responds to abuse, identifying distinct Failure modes and safety margins. Safety testing reveals that hotspot formation, venting behavior, and electrolyte oxidation differ by material system, influencing temperature thresholds and propagation risk. Chemistry tuning focuses on balancing energy density with thermal management, electrolyte formulation, and separator resilience. We present clear metrics for comparing chemistries, emphasizing predictable, repeatable safety performance under accelerated aging and fault scenarios.
Cost Trends and Practical Trade-Offs for Each Chemistry
Cost trends for lithium battery chemistries vary with chemistry, production scale, and supply chain dynamics, and we can summarize the practical trade-offs by focusing on unit cost per kilowatt-hour, capital expenditure, and total ownership costs. We evaluate: cost volatility, supply chain risks, and durability of economics across chemistries, with attention to manufacturing maturity. In practice, Li‑ion chemistries trade lower energy density against cost stability, cycle life, and recycling value. The table below captures core considerations.
| Dimension | Impact |
|---|---|
| Unit cost/kWh | Varies by chemistry and scale |
| Capex | Factory modernization and equipment intensity |
| Ongoing costs | Maintenance, cooling, and end-of-life handling |
Efficient planning requires anticipating cost volatility and supply chain risks to optimize total ownership costs.
Match the Chemistry to Your Use Case: Common Scenarios
When selecting a lithium battery chemistry for a given use case, we prioritize alignment between performance needs and economics, balancing energy density, cycle life, and cost stability. We map scenarios to chemistries by evaluating mission-critical metrics: energy per mass, charge retention, thermal behavior, and charge/discharge rates. For hobbyist applications, high energy density with forgiving safety margins guides LiPo and Li-ion choices, while consumer electronics favor stable voltage curves and long cycle life. Aerospace considerations demand ruggedization, temperature tolerance, and reliable hard-cycle performance, often favoring lithium-sulfur or high-rate lithium nickel manganese cobalt oxides. Underwater use emphasizes low self-discharge, sealed packaging, and depth-rated safety. Across all cases, we weigh system-level costs, integration complexity, and lifecycle implications to select a robust, fit-for-purpose chemistry.
Real-World Tests and Reliability Indicators to Watch
What real-world tests should we rely on to gauge a lithium battery’s reliability, and what indicators matter most in practice? We rely on controlled cycle life tests, rate capability, and calendar aging under representative temperatures and duty cycles. We track capacity retention, coulombic efficiency, resistance growth, and parasitic current trends to identify degradation modes early. Short-term stress tests reveal thermal behavior, impedance rise, and safety margins during overcurrent or fast-charging scenarios. Realistic aging metrics combine capacity fade with internal resistance increase, correlating to runtime loss and voltage sag under load. From a reliability standpoint, battery aging indicators guide service intervals and warranty thresholds, while charging etiquette—consistent charging procedures and temperature-aware limits—reduces premature wear. Informed interpretation prevents overestimation of performance without sacrificing safety or lifecycle longevity.
Future-Proofing With Scalable Chemistries: Planning for Growth
Are we ready to anticipate tomorrow’s battery needs by selecting chemistries that scale with demand and deployment? We articulate a framework for future-proofing growth through scalable roadmaps, anchored in rigorous energy density forecasts and reliability targets. Our assessment weighs manufacturing scalability against material availability, balancing high performance with practical production capability. We examine safety standards as constraints that shape chemistry selection and process controls, ensuring consistent quality across volumes. End of life planning emerges as a design criterion, guiding recycling implications and second-life potential to maximize value and minimize waste. We map global supply risks to sourcing strategies, urging diversification and strategic reserves. In sum, scalable chemistries enable adaptive deployments, aligning technical ambition with economic resilience and environmental responsibility.
Frequently Asked Questions
How Do You Compare Energy Density in Real-World Devices?
We compare energy density in real-world devices using metrics like specific energy and volumetric energy, plus comparison metrics tied to power density, to reflect how mass, volume, and discharge rate affect practical performance for end users.
Which Chemistry Handles High-Temperature Operation Best?
We handle high-temperature operation best with high temperature chemistry, and we don’t ignore thermal runaway indicators; you might doubt it, but our analysis shows stable performance under heat while monitoring for precursors and trends.
What Are the True Cycle Life Expectations per Use Case?
We expect true cycle life varies widely, but per use case, typical values range from 300 to 2,500 cycles, with LiFePO4 higher durability and NMC lower, depending on depth of discharge, temperature, and charging protocols.
How Does Cost Scale With Capacity and Safety Features?
Cost scales with capacity nonlinearly: doubling capacity increases base material costs, but economies of scale and module design temper total price. Safety feature impact adds meaningful, sometimes disproportionate, costs due to added containment, monitoring, and thermal management requirements.
What Signs Indicate a Battery Chemistry Is Date-Expired?
We can spot signs of expiration by reduced capacity, increased self-discharge, swelling, venting, and erratic voltage. Our chemistry degradation observations point to impaired performance, unsafe temperature behavior, and declining cycle life as major indicators we monitor closely.
Conclusion
We’ve mapped the terrain, charting each chemistry’s strengths and limits so you can steer with confidence. By weighing energy density, safety, cost, and reliability, we align your use case with a scalable path that ages gracefully and foresees second lives. Think of it as tuning a complex instrument: every material choice adds a note—balanced, disciplined, and forward-looking. In short, the right chemistry is the steady heartbeat of durable, future-ready design.

